crystal clear mathematics logo

bannerabout
graemethin
bannerdive
graemethin2

Sign up to my Newsletter

EASIER THAN YOU THINK...

Statistics

Image of the Cover of MODE Magazine from August-September 1997What is statistics?

Statistics is the science (and art) of collecting, analysing and presenting data.  Statisticians study a situation (or a population) in order to better describe it, to draw conclusions from it (to better understand it), and to make informed predictions and decisions concerning the possible future of that situation (or population).

Bureaucracies have always collected and used data, from the time of the Sumerian, Babylonian, Egyptian and Chinese civilisations onwards.  They have usually done so for the purposes of organising trade and for running government projects and services.  Such activities are necessary for the smooth functioning of any society.

Statisticians are involved in every step of the process, from designing the experiments, designing questionnaires and collecting data, to analysing the data in a variety of ways, and presenting the analysis in a form that provides clear understanding to others.

It is difficult to think of any area of modern society in which ststistics does not play some role.  It is involved in

  • Studying the effectiveness of farming techniques, equipment, seeds/stock, production and marketing of produce
  • Studying the effectiveness and efficiencies and cost-effectiveness of mining of all kinds
  • Evaluating the effectiveness of pharmaceuticals and medical treatments of all kinds
  • Calculating risks from exposure to diseases and environometal pollutants
  • Evaluating the effectiveness of nursing, aged-care, teaching, policing, and military interventions
  • Preparing and analysing political opinion polls, to study the popularity of policies and parties
  • Estimating the demand for products and identifying target markets for them
  • Studying the populations of animals and plants to aid int he wise development of conservation policies
  • Analysing and controlling the quality of industrial production and determining appropriate warranties for products
  • Forecasting earthquakes, volcanic eruptions, tsunamis and weather
  • Analysing the results of scientific experiments
  • Analysing the financial markets inclusing housing, stocks, and monetary values
  • Risk analysis for new ventures and for work environments
  • and the list goes on and on!

Let me recommend that you gain at least a basic understanding of what questions statisticans ask, what ‘tools’ they use, and how they go about answering questions.

PS  The reason that I used the cover of a women's fashion magazine in order to introduce statistics is that MODE is a statistical term meaning "most popular."  You will learn more of this later!
How to Read and Use a Statistical Table (Elementary)

A number of my students come to me struggling with statistics.

A very common problem is that they don't have a clear understanding of how to analyse data using a Frequency (Distribution) Table.

A Frequency Distribution Table With Four Columns - Score, Frequency, Frequency times Score and Cumulative Frequency

In this video I explain that statisticians have two fundamental questions that they ask about all data that they study: "Where do the scores mostly lie?" and "How spread out are the scores?"

The first question is seeking what statisticians call "measures of central tendency." They call these measures "averages," which is why we must be very careful in using the term "average" around a statistician! For them, it can have quite a few different meanings. What most of us call an "average" in daily life a statistician would call an "arithmetic mean" or, simply, a "mean." Of the many measures of central tendency that interest statisticians, the three most commonly studied in schools are: the (arithmetic) mean, the mode and the median.

The second question is seeking "measures of spread." The three measures most commonly studies in schools are the range, Inter-Quartile Range and Standard Deviation.

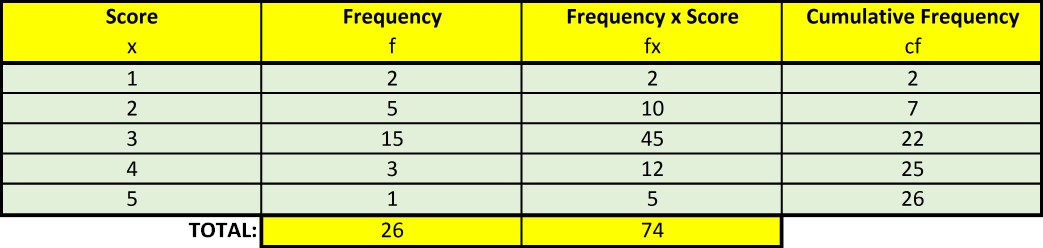
In using a table to analyse data, each column has a job to do. I explain how the first column (the 'Score' column) is used to find the Range; the second column (the 'Frequency' column) is used to find the Mode; the third column (the 'fx' column) is used to calculate the mean; and the fourth column (the 'cf' column) is used to find the median score.

You will also learn what some of the symbols mean (Σf, Σfx, σ, and x̄). You will even learn of a women's fashion magazine called MODE that is no longer published but has great relevance for understanding statistics.

We were all deeply impressed with Graeme from the very beginning. [Lucas’] confidence radically changed within only 3 weeks of Graeme’s instruction and assistance. I am sure this was largely attributed to Graeme’s infectious passion and love for his subject, and his high personal level of skill, teaching experience and understanding of mathematics. Lucas always found Graeme could explain concepts so knowledgeably and easily, which really did transform Lucas’ appreciation and enjoyment of the subject. Graeme always gave Lucas assistance and time over and above his hour’s tutoring session. Graeme has developed a wonderful relationship and more of a mentoring role which has been of great assistance and value to Lucas as he faces the pressures of his final year of school.  I have no hesitation in recommending Graeme as an outstanding tutor and friend, and a very wise, knowledgeable and capable teacher of the highest calibre.
Sally T (parent, 2005)

See all Testimonials

Sign up to my Newsletter

Copyright © Crystal Clear Mathematics | All Rights Reserved

Website Design: www.webdesignnsw.com.au | Photography: Katieriversphotography.com.au